Please select relevant station from the District drop down menu above to view incident statistics for individual stations.
Brigade Summary
| Incident Type | Last Year Actual | Current Year Actual | % Change | Movement | Performance Key |
|---|---|---|---|---|---|
| All Emergency Incidents | 9,660 | 11,042 | 14.31% | Requires Improvement | |
| Primary Fires | 902 | 984 | 9.09% | Adequate Performance | |
| Secondary Fires | 3,879 | 4,956 | 27.76% | Requires Improvement | |
| Special Services (RTCs etc) | 1,598 | 1,587 | -0.69% | Performing Well | |
| False Alarms | 3,216 | 3,438 | 6.9% | Adequate Performance | |
| Other Incidents* | 65 | 77 | 18.46% | Requires Improvement | |
| Fire Fatality | 2 | 3 | 50.0% | Requires Improvement | |
| Fire Injury | 18 | 9 | -50.0% | Performing Strongly | |
| Accidental Dwelling Fires | 168 | 213 | 26.79% | Requires Improvement | |
| Accidental Fires | 733 | 1,015 | 38.47% | Requires Improvement | |
| Deliberate Fires | 4,051 | 4,925 | 21.57% | Requires Improvement | |
| Safer Homes Visits (by completing station) | 21,797 | 16,958 | -22.2% | Requires Improvement | |
| Sickness Absence | 11.09 | 10.96 | -1.17% | Performing Well |
| Last Year Start Date | Last Year End Date | Current Year Start Date | Current Year End Date |
|---|---|---|---|
| April 2024 | March 2025 | April 2025 | March 2026 |
NOTE:
Last Data Uploaded May 1, 2026, 1:21 p.m.
- All statistics may be subject to change following final data validation
- Primary Fires are fires that occurred to property, vehicles and or involved casualties and or involved 5 or more pumping appliances.
- Secondary Fires are NOT property fires eg. rubbish, grassland, wheelie bins and derelict buildings.
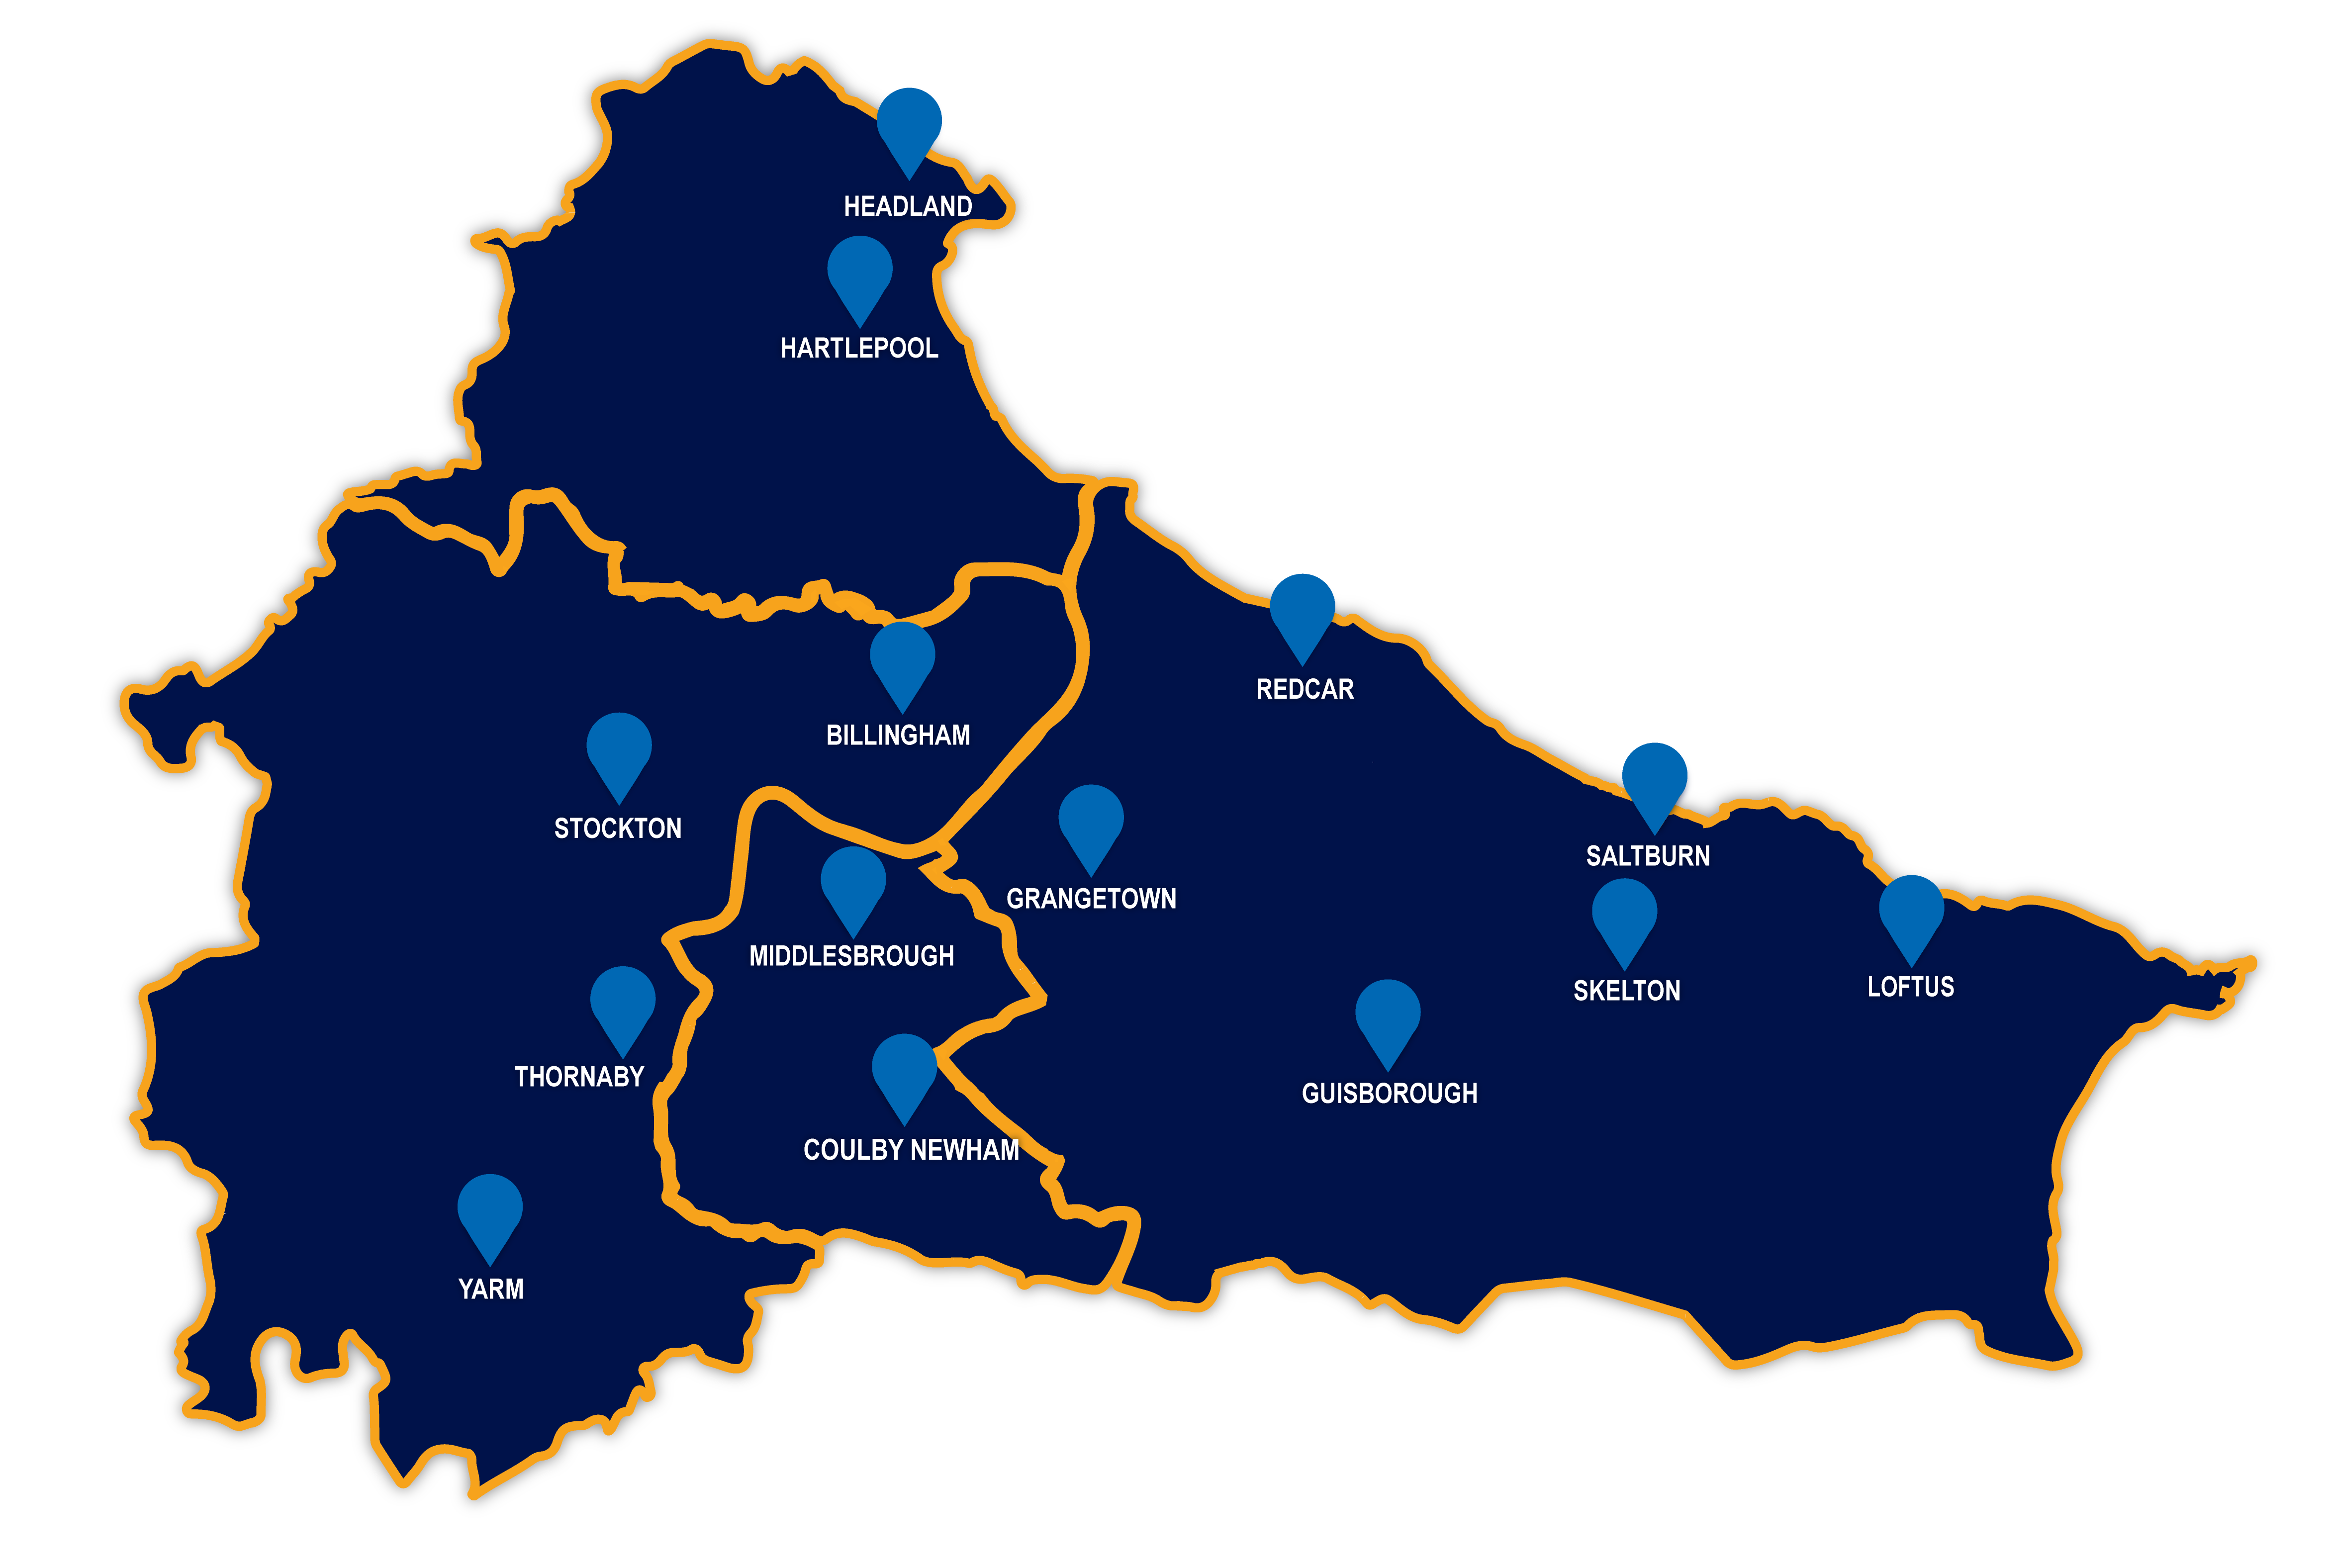
- Wholetime Stations: Middlesbrough, Grangetown, Thornaby, Billingham, Coulby Newham, Hartlepool
- Wholetime / On-Call Stations: Stockton, Redcar
- On-Call Stations: Headland, Yarm, Guisborough, Saltburn, Skelton, Loftus