Please click on Back to District Level above to show Incident Statisitics for that District and to select a different Ward, data is visible in the table on the right.
Alternatively, if you wish to view Brigade wide incident data, use the Brigade Wide Summary button above.
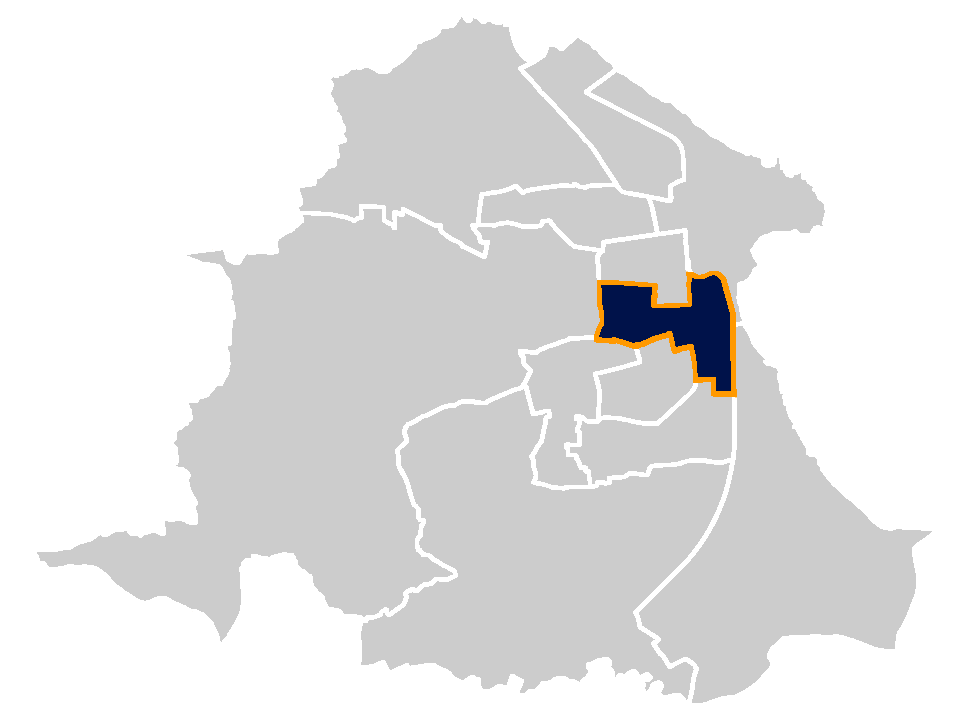
Burn Valley Ward Summary
| Incident Type | Last Year Actual | Current Year Actual | % Change | Movement | Performance Key |
|---|---|---|---|---|---|
| Deliberate Fires | 88 | 50 | -43.18% | Performing Strongly | |
| Deliberate Primary Fires | 13 | 4 | -69.23% | Performing Strongly | |
| Deliberate Secondary Fires | 75 | 46 | -38.67% | Performing Strongly | |
| Deliberate Dwelling Fires | 2 | 1 | -50.0% | Performing Strongly | |
| Accidental Dwelling Fires (ADF's) | 4 | 4 | 0.0% | Performing Strongly | |
| Accidental Dwelling Fire Injury | 0 | 1 | 100% | Requires Improvement |
| Last Year Start Date | Last Year End Date | Current Year Start Date | Current Year End Date |
|---|---|---|---|
| 1st April 2024 | 31st January 2025 | 1st April 2025 | 31st January 2026 |
NOTE:
Last Data Uploaded Feb. 18, 2026, 10:38 a.m.
- All statistics may be subject to change following final data validation
- Primary Fires are fires that occurred to property, vehicles and or involved casualties and or involved 5 or more pumping appliances.
- Secondary Fires are NOT property fires eg. rubbish, grassland, wheelie bins and derelict buildings.